Allacapan is a landlocked municipality in the northwestern part of Cagayan.
The municipality has a land area of 306.80 square kilometers or 118.46 square miles which constitutes 3.26% of Cagayan’s total area. Its population as determined by the 2020 Census was 35,234. This represented 2.78% of the total population of Cagayan province, or 0.96% of the overall population of the Cagayan Valley region. Based on these figures, the population density is computed at 115 inhabitants per square kilometer or 297 inhabitants per square mile.
Barangays:
Allacapan has 27 barangays as shown in the following table.
Barangay |
PopulationPercentace (2020) |
Population (2020) |
Population (2015) |
Change(2015-2020) |
AnnualPopulation Growth Rate (2015-2020) |
Bessang |
3.23% |
1,138 |
1,243 |
-8.45% |
-1.84% |
Binobongan |
2.21% |
779 |
683 |
14.06% |
2.81% |
Bulo |
3.61% |
1,271 |
1,171 |
8.54% |
1.74% |
Burot |
2.81% |
991 |
914 |
8.42% |
1.72% |
Capagaran |
2.72% |
959 |
955 |
0.42% |
0.09% |
Capalutan |
1.96% |
690 |
700 |
-1.43% |
-0.30% |
CapanickianNorte |
3.37% |
1,189 |
1,257 |
-5.41% |
-1.16% |
CapanickianSur |
5.00% |
1,760 |
1,696 |
3.77% |
0.78% |
Cataratan |
6.62% |
2,332 |
2,040 |
14.31% |
2.86% |
Centro East |
5.31% |
1,870 |
1,667 |
12.18% |
2.45% |
Centro West |
5.39% |
1,898 |
2,040 |
-6.96% |
-1.51% |
Daan-Ili |
5.31% |
1,870 |
1,702 |
9.87% |
2.00% |
Dagupan |
3.91% |
1,376 |
1,420 |
-3.10% |
-0.66% |
Dalayap |
1.77% |
622 |
596 |
4.36% |
0.90% |
Gagaddangan |
0.63% |
223 |
199 |
12.06% |
2.43% |
Iringan |
5.31% |
1,872 |
1,801 |
3.94% |
0.82% |
Labben |
6.24% |
2,199 |
1,754 |
25.37% |
4.87% |
Maluyo |
5.00% |
1,761 |
1,607 |
9.58% |
1.94% |
Mapurao |
5.22% |
1,839 |
1,669 |
10.19% |
2.06% |
Matucay |
6.09% |
2,145 |
2,415 |
-11.18% |
-2.46% |
Nagattatan |
4.49% |
1,583 |
1,523 |
3.94% |
0.82% |
Pacac |
2.63% |
926 |
851 |
8.81% |
1.79% |
San Juan |
1.40% |
493 |
454 |
8.59% |
1.75% |
Silangan |
2.21% |
778 |
584 |
33.22% |
6.22% |
Tamboli |
2.33% |
820 |
869 |
-5.64% |
-1.21% |
Tubel |
1.64% |
579 |
522 |
10.92% |
2.21% |
Utan |
3.61% |
1,271 |
1,239 |
2.58% |
0.54% |
AllacapanTotal |
35,234 |
33,571 |
4.95% |
1.02% |
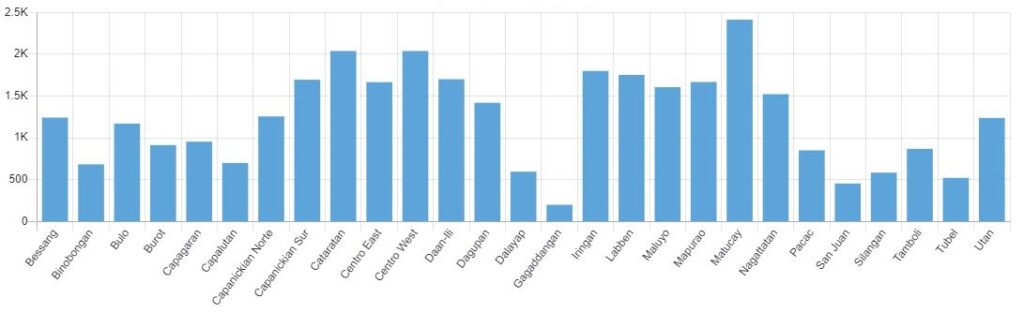
Population 2020
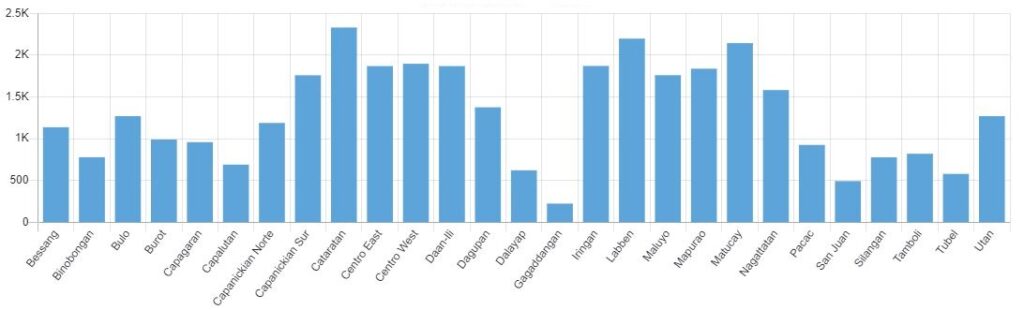
Population 2015
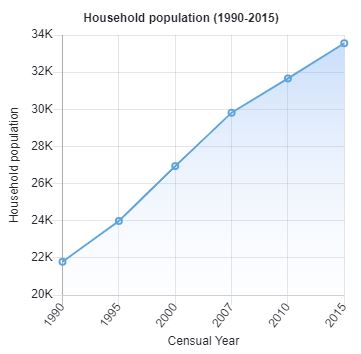
Demographics
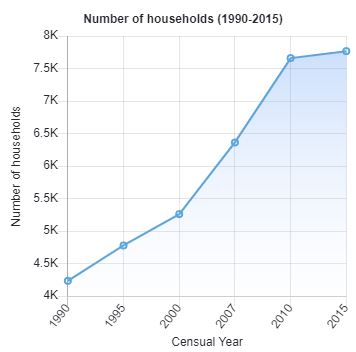
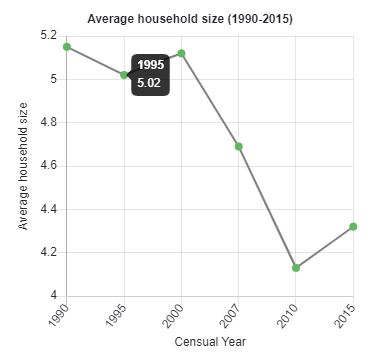
The household population of Allacapan in the 2015 Census was 33,555 broken down into 7,767 households or an average of 4.32 members per household.
DEMOGRAPHICS
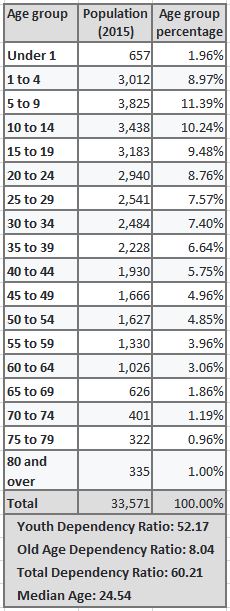
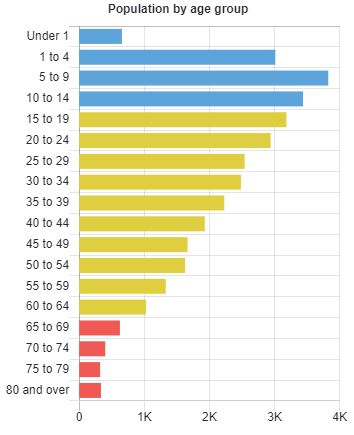
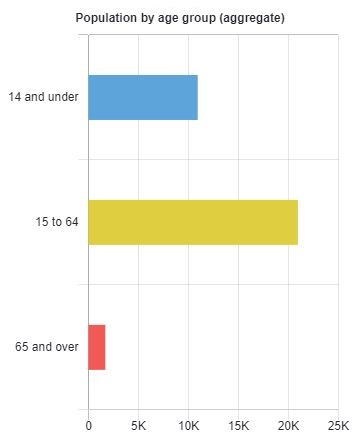
According to the 2015 Census, the age group with the highest population in Allacapan is 5 to 9, with 3,825 individuals. Conversely, the age group with the lowest population is 75 to 79, with 322 individuals.
Combining age groups together, those aged 14 and below, consisting of the young dependent population which include infants/babies, children and young adolescents/teenagers, make up an aggregate of 32.56% (10,932). Those aged 15 up to 64, roughly, the economically active population and actual or potential members of the work force, constitute a total of 62.42% (20,955). Finally, old dependent population consisting of the senior citizens, those aged 65 and over, total 5.02% (1,684) in all.
The computed Age Dependency Ratios mean that among the population of Allacapan, there are 52 youth dependents to every 100 of the working age population; there are 8 aged/senior citizens to every 100 of the working population; and overall, there are 60 dependents (young and old-age) to every 100 of the working population.
The median age of 25 indicates that half of the entire population of Allacapan are aged less than 25 and the other half are over the age of 25.
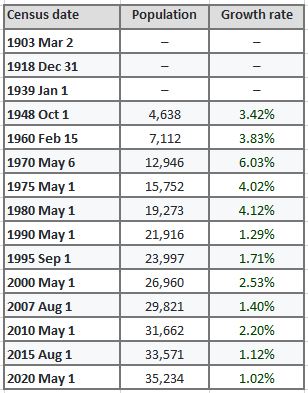
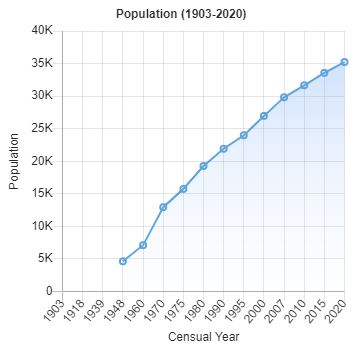
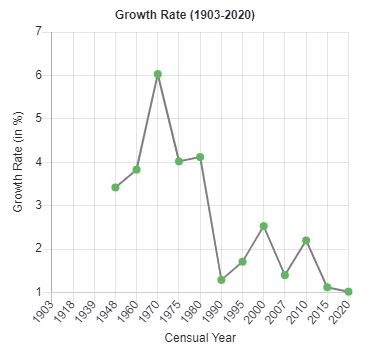
historical population
The population of Allacapan grew from 3,342 in 1939 to 35,234 in 2020, an increase of 31,892 people over the course of 81 years. The latest census figures in 2020 denote a positive growth rate of 1.02%, or an increase of 1,663 people, from the previous population of 33,571 in 2015.
The total number of registered voters or electorate in Allacapan for the year 2019 was 21,967, broken down into 11,067 males and 10,900 females.
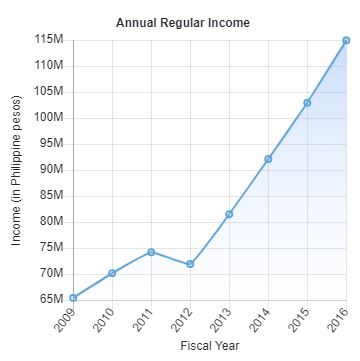
Economy
Fiscal Year |
Annual Regular Income |
Change |
2009 |
65,413,382.26 |
– |
2010 |
70,162,580.68 |
7.26% |
2011 |
74,183,838.04 |
5.73% |
2012 |
71,926,554.79 |
-3.04% |
2013 |
81,496,293.97 |
13.30% |
2014 |
92,102,745.30 |
13.01% |
2015 |
102,934,114.64 |
11.76% |
2016 |
114,929,479.23 |
11.65% |